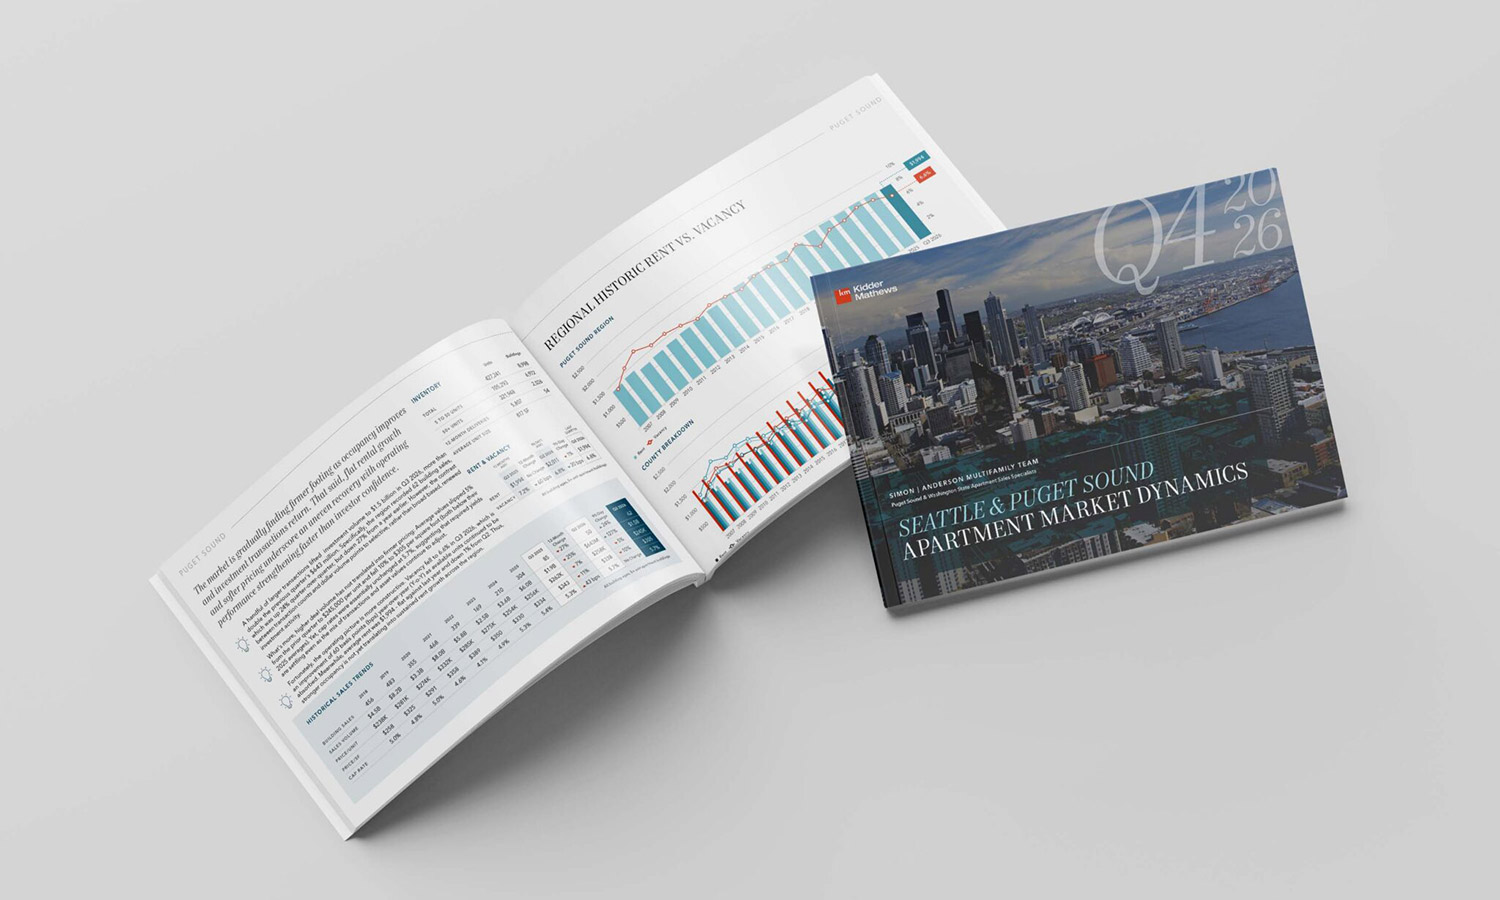
The market is gradually finding firmer footing as occupancy improves and investment transactions return. That said, flat rental growth and softer pricing underscore an uneven recovery with operating performance strengthening faster than investor confidence.
A handful of larger transactions lifted investment volume to $1.5 billion in Q3 2026, more than double the previous quarter’s $643 million. Specifically, the region recorded 62 building sales, which was up 24% quarter-over-quarter, but down 27% from a year earlier. However, the contrast between transaction counts and dollar volume points to selective, rather than broad-based, renewed investment activity.
What’s more, higher deal volume has not translated into firmer pricing: Average values slipped 5% from the prior quarter to $245,000 per unit and fell 10% to $305 per square foot (both below their 2025 averages). Yet, cap rates were essentially unchanged at 5.7%, suggesting that required yields are settling even as the mix of transactions and asset values continue to adjust.
Fortunately, the operating picture is more constructive. Vacancy fell to 6.6% in Q3 2026, which is an improvement of 60 basis points (bps) year-over-year (Y-o-Y) as available units continued to be absorbed. Meanwhile, average rent was $1,994 – flat against last year and down 1% from Q2. Thus, stronger occupancy is not yet translating into sustained rent growth across the region.
SEATTLE
Seattle’s leasing performance continues to stabilize, but buyers remain selective and pricing has yet to find a clear floor. Of course, stronger occupancy provides a foundation for recovery, even as limited rent growth and higher required yields constrain investment momentum.
- Sales Insight
Larger properties accounted for a greater share of Seattle’s sales activity in Q3 2026. More precisely, the city logged 23 transactions totaling $352 million – 44% fewer sales than a year earlier, even as dollar volume increased 4%. At the same time, average pricing fell to $248,000 per unit and $385 per square foot, while cap rates reached 5.7% (up 63 bps Y-o-Y). As such, the market remains active, but buyers are pricing risk more conservatively. - Rent/Vacancy Insight
Leasing conditions strengthened modestly in Seattle despite little movement in rents. Here, the average monthly rent was $2,068 in Q3 2026 (up 0.3% from Q2, but 1% below the year-earlier level), and rent per square foot was $3.14. Vacancy also narrowed to 6.6%, improving 20 bps Q-o-Q and 30 bps Y-o-Y. As usual, demand is helping absorb inventory, although pricing power remains limited.
NORTH KING
North King’s leasing recovery is becoming clearer with vacancies easing even as rents remain subdued. However, the sales market is harder to read as very few properties traded hands, and changes in the mix of transactions can produce large swings in reported pricing.
- Sales Insight
North King remains one of the region’s thinnest transaction markets. That’s because five buildings sold in Q3 2026 for a combined $17 million, compared to one sale totaling $78 million in Q2. Accordingly, reported prices fell to $207,000 per unit and $232 per square foot, while the average cap rate dropped to 3.5%. So, given the small sample and sharp shift in transaction size, these changes should not be read as a definitive, market-wide repricing. - Rent/Vacancy Insight
The most notable shift in the market in North King is continued occupancy improvement. Vacancy declined to 7.7% in Q3 2026, dropping from 8% in Q2 and 10.4% a year earlier. Yet, rents are slower to respond: The average monthly rent slipped to $1,816, down 0.3% Q-o-Q and 1% Y-o-Y, with rent per square foot essentially flat at $2.43. The gap suggests that absorption is preceding any recovery in pricing power.
EAST KING
East King continues to draw capital for sizable properties despite a relatively small pool of trades. In this case, leasing demand is firming and vacancy is trending lower, although rents and transaction pricing show that investors and operators remain sensitive to affordability and return expectations.
- Sales Insight
East King’s six multifamily sales generated $366 million in Q3 2026 – an outsized total compared to the $105 million transacted in the preceding quarter. That surge in dollar volume came alongside lower average sale metrics – $414,000 per unit and $394 per square foot, down 9% and 13%, respectively. Cap rates also moved down to 4.6% from 5%. Clearly, the quarter highlights a continued appetite for larger assets, rather than a uniform strengthening in prices. - Rent/Vacancy Insight
Vacancy in East King eased to 6.6% for a 20-basis-point quarterly improvement to finish 70 bps below Q3 2025. Nevertheless, rental rates edged down: The average rent was $2,092 (1% below Q2 and virtually unchanged year-over-year), while rent per square foot fell to $2.76. And, while occupancy gains are a positive sign, they have not yet given landlords much room to raise rents.
SOUTH KING
South King is attracting larger transactions again, although buyers continue to approach pricing cautiously. But, leasing conditions offer a steadier story as gradual occupancy gains help balance modest rental softness.
- Sales Insight
The return of larger transactions helped South King post $250 million in multifamily sales in Q3 2026, up sharply from just $23 million in Q2. In this case, 10 properties changed hands, compared to seven the previous quarter. Despite that increase in activity, average prices slipped to $189,000 per unit and $233 per square foot. Cap rates also narrowed to 5.9% from 6.1%, indicating mixed pricing signals, rather than an unambiguous recovery. - Rent/Vacancy Insight
South King’s vacancy rate improved to 6.4% in Q3 2026, down 30 bps from Q2 and 20 bps from a year earlier. But, rent trends were less encouraging: The average of $1,813 was down 0.1% Q-o-Q and 0.5% Y-o-Y, while rent per square foot eased to $2.14. As such, the submarket is absorbing available units, but landlords are still seeing little rental growth.
SNOHOMISH
In Snohomish, a small number of large property sales pushed investment volume higher and lifted reported average prices. On the leasing side, lower vacancy offers some encouragement, although softer rents temper the improvement.
- Sales Insight
Snohomish’s headline sales figures were shaped by just four Q3 2026 transactions totaling $394 million. Consequently, dollar volume rose substantially from $162 million in Q2 despite no increase in the number of transactions. Specifically, average prices climbed 40% to $314,000 per unit and 52% to $353 per square foot, while cap rates increased to 5.5%. But, with so few trades, the results likely say more about which assets sold than about underlying market appreciation. - Rent/Vacancy Insight
Snohomish’s occupancy trend continues to improve: Vacancy fell to 6.2% in Q3 2026 from 6.6% in Q2 and 6.5% a year earlier. At the same time, average rents declined 2% Q-o-Q to $1,900 and 0.4% Y-o-Y. Rent per square foot also slipped to $2.19. The combination suggests that leasing demand is absorbing supply without yet supporting stronger rents.
PIERCE
Pierce remains a cautious investment market with lower sale prices and higher cap rates pointing toward continued pressure on valuations. Overall, its leasing market held up better, supported by improving occupancy and generally stable rental rates.
- Sales Insight
Transaction counts recovered in Pierce County during Q3 2026, but total investment remained well below last year’s level. Namely, 11 properties sold for $35 million, as compared to four transactions and $11 million in Q2. Even so, volume was still down 82% Y-o-Y. Average pricing also eased to $192,000 per unit and $194 per square foot, while cap rates widened to 6.8%. With that, buyers continue to demand higher yields amid subdued liquidity. - Rent/Vacancy Insight
Pierce’s operating market is comparatively resilient. Here, average monthly rent reached $1,675 in Q3 2026 (around 1% above last year and virtually unchanged from Q2), while rent per square foot held at $2.01. Meanwhile, vacancy tightened to 6.6%, improving by 30 bps Q-o-Q and 50 bps Y-o-Y. Essentially, better occupancy is supporting stability, even without meaningful rent acceleration.
KITSAP
Kitsap continues to offer a relatively steady leasing environment with modest rent gains during the last year and improving occupancy. That said, the investment market remains thin, which makes quarterly fluctuations in sales volume and price metrics difficult to interpret with confidence.
- Sales Insight
Only three multifamily properties traded in Kitsap during Q3 2026, generating $42 million in sales. Granted, this was an increase from one sale totaling $17 million in Q2, but dollar volume still remained 61% below Q3 2025. Price per unit was also essentially unchanged quarter-over-quarter at $239,000, whereas price per square foot fell 20% to $219. With limited evidence from completed sales, the direction of underlying valuations remains uncertain. - Rent/Vacancy Insight
Kitsap’s vacancy rate fell to 7.5% in Q3 2026 – 30 bps below Q2 and 20 bps below last year. At the same time, average monthly rent was $1,876 (down 0.4% from the previous quarter, but 1% higher year-over-year), while rent per square foot eased to $2.19. Generally, leasing conditions appear stable overall with occupancy gains outweighing a modest near-term slowdown in rental rates.
About the Simon | Anderson Multifamily Team
The apartment brokerage team led by Dylan Simon and Jerrid Anderson of Kidder Mathews represents apartment investors, developers, and landowners in the sale and purchase of apartment buildings and development land across the entire State of Washington. The team of 15 brokerage professionals specializes in the sale and purchasing of apartment buildings and development land from $1 million to more than $100 million. For more information, visit simonandersonteam.com.
About Kidder Mathews
Kidder Mathews is the largest fully independent commercial real estate firm in the Western U.S., with over 900 professionals in 20 offices across Washington, Oregon, California, Nevada, Arizona, and Texas. We offer a complete range of brokerage, appraisal, asset services, consulting, and debt & equity finance services for all property types. Kidder Mathews averages $9 billion in transaction volume, manages 55 million square feet of space, and conducts nearly 2,700 appraisal, consulting, and cost segregation assignments annually. For more information, visit kidder.com.
Read the full report at the link below.
Contact
Simon | Anderson Multifamily Investments Team
Dylan Simon, Executive Vice President
Jerrid Anderson, Executive Vice President
Matt Laird, First Vice President
Max Frame, Vice President
Elijah Piper, Vice President
Matt Johnston, Vice President
JD Fuller, Senior Associate
Jack Shephard, Senior Associate