
It’s challenging to truly capture the rocky road that apartment sales transactions faced in 2020. This past year might best be detailed in a quarter-by-quarter break-down.
Q1 The False Start
Although most everyone in the apartment market knew that 2020 sales volume would amount to a far-cry from that achieved in 2019, an otherwise predictable start to the year ended in an edge-of-the-cliff standstill by March 2020.
Q2 The Adjustment
Summer months saw few new listings – or sales – as owners and investors alike surveyed the market, attempting to understand the impacts of slowing economic fundamentals, health crisis uncertainty leading to changing renter preferences, and challenging legislative headwinds.
Q3 A ‘New” Normal
By the second half of the year, the apartment investment market gained steam. Market specific fundamentals proved variable across the region – with a demonstrated shift to sales of smaller assets and more suburban located assets.
Q4 Catch-up
By the fourth quarter of the year listing volume increases consummated in sales, with Q4 accounting for nearly 50% of all sales in 2020. The year ended on a strong note of sales with cap rates not far off from previous years. Pricing changes were variable across markets (as described in greater detail in this study), and sales volume decreased 65% from 2019.
Historical Performance
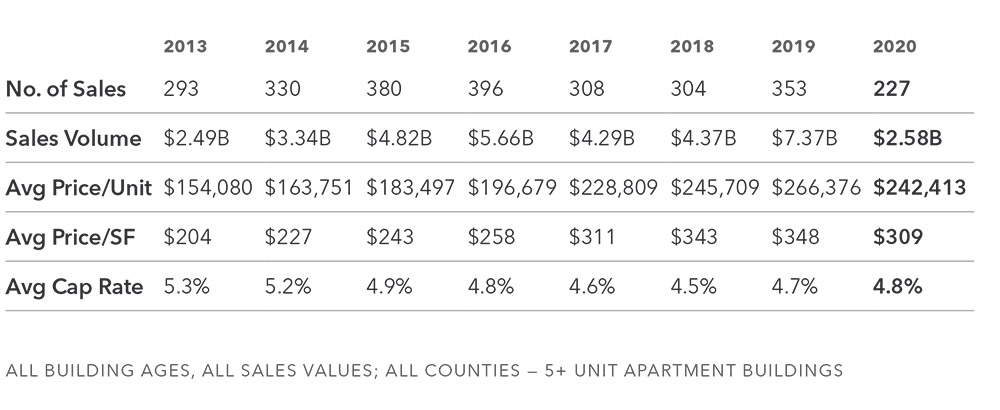
A historical look back at the last 15 years of apartment sales in the Seattle & Puget Sound region does little to demonstrate the challenges faced in the market during this past year. In a year where it was surprising that any sales were consummated, the sales market demonstrated far more velocity and vibrancy than the Great Recession years of 2009 – 2011 yet paled in comparison to the YOY sales years spanning 2015 – 2019.
A review of historical sales volume, velocity, and pricing clearly demonstrates slowed sales volume, yet consistent investor demand is evidenced by only nominal changes in cap rates over the last six years.
What is hidden in summary data is better illustrated in the pages of this study. Namely, sales volume and pricing were highly variable based on asset vintage, size, and location. In 2020, investors favored smaller and more suburban-located assets, and a healthy bid-ask spread slowed sales volume, yet preserved overall asset pricing.
Sales Velocity
|
Average Cap Rate
|
2020 Sales Metrics by Submarket
It’s no surprise that apartment investment in the Puget Sound Region looked much different in 2020 than previous years. Although sales volume of $2.6B in 2020 is demonstrably lower than its 2019 peak, sales velocity picked up considerably at the end of the year with nearly 40% of closings occurring in Q4 alone.
Urban King
Urban King County yet again retains its top spot as the most active sales market, with 77 sales equating to nearly 35% of the region’s total transaction volume. This coupled with the highest average price per square foot in the region, further demonstrates investors’ willingness to “pay-up” to own in Urban King County.
Suburban Markets
Suburban markets fared well in a tumultuous 2020, with nearly all submarkets experiencing compressing cap rates and retaining strong pricing. South King County leads the charge with $708M in transaction volume and record-setting average price per square foot. Investor demand continues its strong trend outside the urban core.
Read the full study at the link below.
Provided By
Simon | Anderson Multifamily Investment Team
Dylan Simon, Executive Vice President
Jerrid Anderson, Executive Vice President
Alex Mundy, Debt & Equity Finance
Matt Laird, Senior Associate
Brandon Lawler, Associate Vice President
Winslow Lee, Associate
Notes & Data Sources
1 Sales data for the Puget Sound region is inclusive of all 5+ unit market-rate apartment
buildings in King, Snohomish, Pierce, and Kitsap Counties.
2 Year-over-year employment growth is calculated as the change in employment from December 2019 to December 2020 by county, utilizing data provided by the Washington State Employment Security Department.
3 Year-over-year wage growth is calculated as the change in average weekly wages from June 2019 to June 2020 by county, utilizing data provided by the U.S. Bureau of Labor Statistics Quarterly Census of Employment and Wages.