Over the last three years, the industrial real estate sector has been strong in Portland and throughout the Northwest. However real estate professionals and investors are grappling with what to expect in the changing economy. Questions loom over the impact of industrial cap rates in the near term as leasing and sales slow.
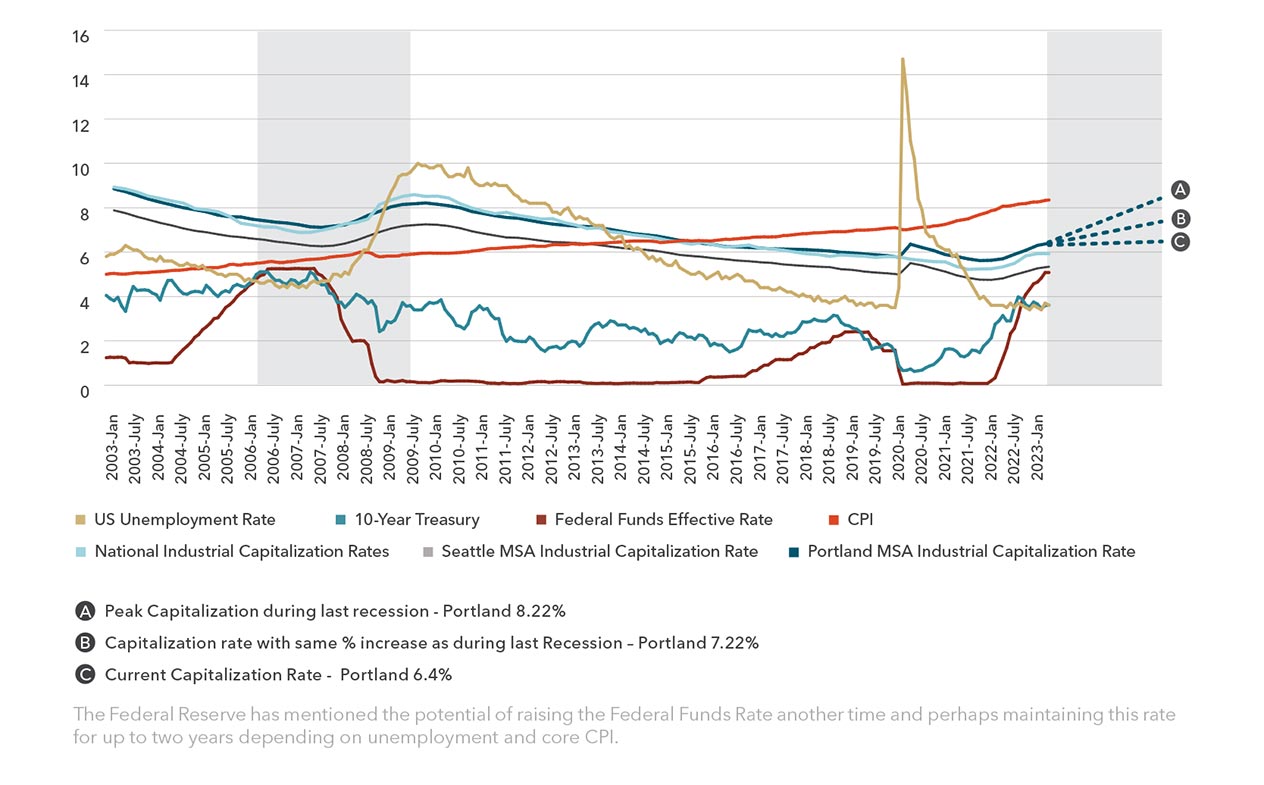
Many economists currently predict federal fund rates will start to drop near the end of 2023 or in early 2024, which is far shorter than the year-long period that rates remained fixed at 5.25% preceding the last recession. The problem being inflation remains high, and the Federal Reserve is trying to slow job growth because it believes that the current pace of economic activity is too strong and is contributing to inflation.
Looking at changes in cap rates and how near they were to the Federal Funds Effective Rate leading into the Great Recession, versus current conditions, many are not sure the US economy is going to see a soft landing, and investor uncertainty, if not already growing, will be doing so shortly.
Regardless, most believe that capitalization rates are due to rise sharply. It’s at this transition period that input and guidance from a real estate professional can really benefit investors.
Historical Industrial Trends
Context and Background
The Fed is trying to strike a delicate balance between slowing job growth enough to help control inflation but not so much that it causes a recession. It is a difficult task, and it is one that the Fed will likely be grappling with for some time to come. Slowing job growth will cool inflation, prevent a wage-price spiral, and possibly avoid a recession – emphasis on possibly.
In this context, the Fed is committed to keeping inflation in check, and it is willing to take steps to slow job growth if necessary.
While there is no direct causal relationship between unemployment and capitalization rates, there can be some indirect factors that may cause an increase in cap rates when unemployment rises, as presented below:
DECREASED DEMAND FOR REAL ESTATE When unemployment rises, consumer spending typically declines, which can result in reduced demand for various types of real estate properties, such as commercial spaces, retail stores, and even residential properties. Lower demand for real estate can lead to increased vacancies and longer lease-up periods, making the investment riskier. To compensate for the higher risk, investors may require higher returns, leading to an increase in cap rates.
ECONOMIC UNCERTAINTY Rising unemployment often reflects broader economic uncertainties and a potential slowdown in economic activity. Uncertainty can make investors more risk-averse, causing them to demand higher returns on their investments. This increased risk perception can translate into higher cap rates.
CASH FLOW CONCERNS When unemployment rises, individuals and businesses may face financial difficulties, leading to an increased risk of defaults on mortgage payments or leases. Investors may anticipate higher vacancies, increased expenses related to tenant turnover, or potential rent reductions. These factors can negatively impact the expected cash flow from a property and increase the perceived risk, resulting in higher cap rates.
FINANCING CHALLENGES During periods of high unemployment, lenders may tighten their lending criteria, making it more difficult for investors to obtain financing for real estate acquisitions. This reduced availability of financing options can reduce the demand for properties and put upward pressure on cap rates.
Real GDP (Gross Domestic Product) is a measure of the total value of all goods and services produced within an economy, adjusted for inflation. It represents the economic output of a country over a specific period, usually a year or a quarter.
Consumer spending plays a crucial role in the United States economy. Prior to the COVID-19 pandemic, consumer spending accounted for approximately 68-70% of the U.S. Gross Domestic Product (GDP) and is currently about 68.4% of GDP. This figure includes expenditures on goods and services by households, such as durable goods (e.g., cars, appliances), nondurable goods (e.g., food, clothing), and services (e.g., healthcare, transportation, and recreation). It is worth noting that this percentage can vary over time based on economic conditions and other factors.
Historical Data
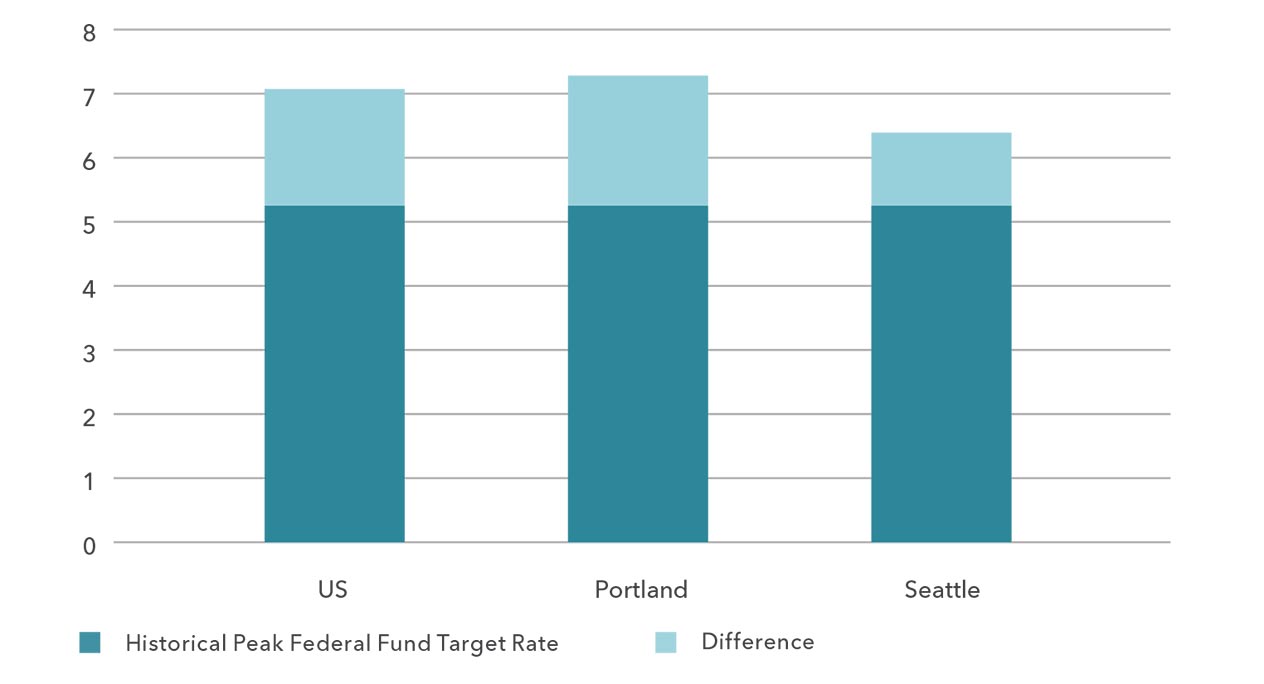
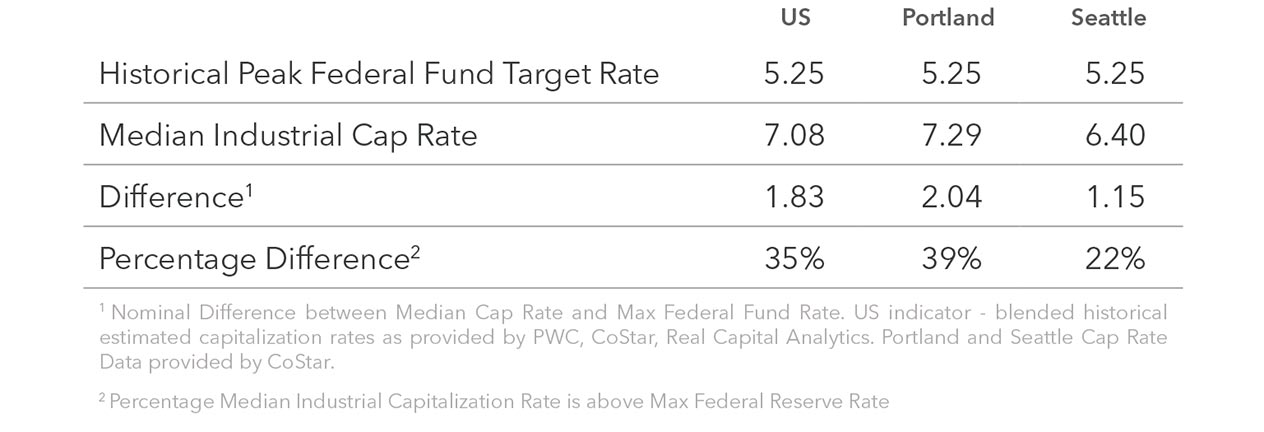
The below measures and illustrates the difference between the estimated Industrial capitalization rates and the peak Federal Fund Target Rate leading into the Great Recession.
Measurements During Max Federal Fund Target Rate
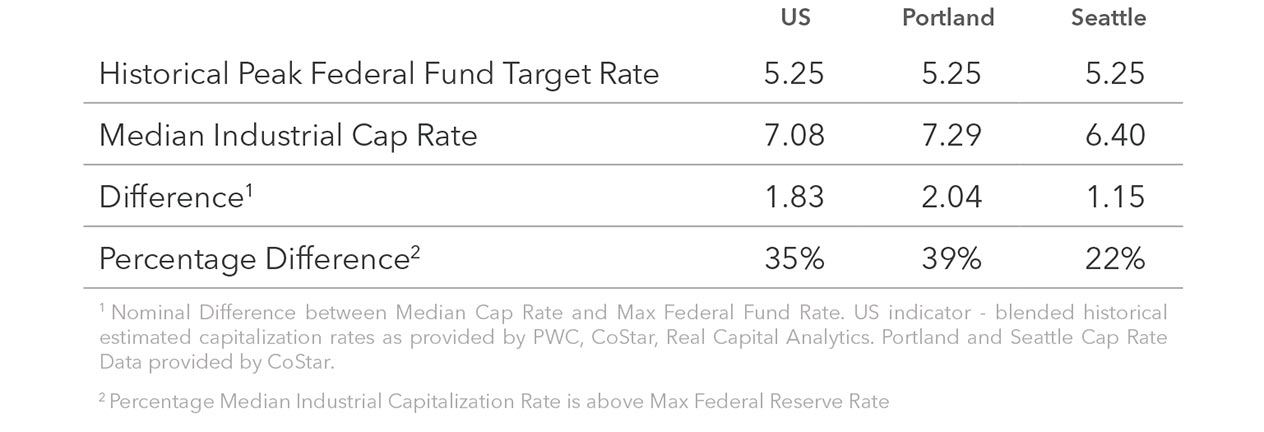
Historical Comparison Industrial Cap Rate vs. Peak Federal Fund Target
Other Historical Information
Prior to the Great Recession, the maximum Federal Fund Target rate of 5.25% began on June 29, 2006 (A) and was in place for about 15 months. In September 2007 (B), the Federal Reserve began lowering their Target Rate. The Federal Funds Target Rate lowered over about a 13-month time period, reaching a range of 0% to 0.25% in December 2008 (C). The chart depicts the corresponding Federal Funds Effective Rate during this time through when industrial capitalization rates reached their peak. It should be noted that from December 2008 (when rates were finally at their lowest (C), the peak industrial capitalization rates for Portland and Seattle weren’t reached for another 12 months (D) and the US peak office capitalization rate wasn’t reached for another 9 months (D). This also indicates that from September 2007 (B), when the Federal Target Rate began to lower, that the peak capitalization rates for Portland, Seattle were reached in 27 months and the US peak capitalization rate was reached in 24 months (D). The chart generally illustrates how the estimated market capitalization rates, as provided by various publications, did not begin to rise until the Federal Reserve Target Rate began to lower (September 2007(B)) and there was a substantial time period after the Federal Funds Target Rate bottomed out (C) before the industrial capitalization rates reached their peak(D).
Historical Comparison Industrial Cap Rate vs. Peak Federal Fund Target Rate
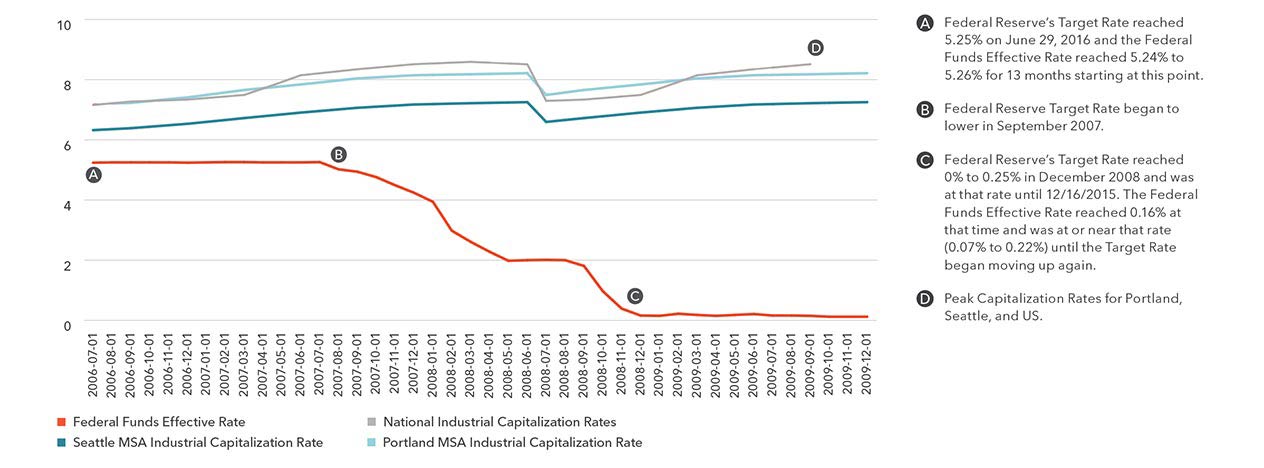
Increase During Great Recession

Current Industrial Cap Rate vs. Federal Fund Target Rate

Projecting
Extending historical data from the Great Recession to the current capitalization environment implies a strong upward movement in capitalization rates, as shown in the below chart. Please note this, as well as the historical data and information related to changes during the Great Recession, are provided as a means of comparison and discussion and not as a specific forecast or an expected future event. Current conditions are different than before the prior recession, including and not limited to the gap between the Federal Funds Rate and Industrial capitalization rates being smaller than before the prior recession as well as the number of other economic factors.
This material should not be considered financial advice. Seek professional guidance and contact your broker to understand how your property competes and compares to the market in general and the market conditions in your property’s immediate area, given its characteristics and specific facts and circumstances.
Implied Future Cap Rate
The relationship between consumer spending, unemployment, and inflation is complex and can vary depending on the overall state of the economy. In general, when consumer spending is high, and unemployment is low, it can create inflationary pressures. Conversely, when consumer spending is low, and unemployment is high, it can lead to deflationary pressures.
Consumer Spending
Consumer spending refers to the total amount of money spent by individuals on goods and services. When consumer spending increases, it generally leads to higher demand for goods and services in the economy. This increased demand, if not met with an equivalent increase in supply, can create upward pressure on prices, leading to inflation. When people have more money to spend, they are willing to pay higher prices, and businesses can increase their prices to maintain profitability.
Impact of Increasing Federal Funds
Increasing the federal funds rate can have a mixed impact on consumer spending. On one hand, higher interest rates can make borrowing more expensive, leading to decreased consumer spending on big-ticket items like houses, cars, and durable goods. This is because higher borrowing costs can make it less affordable for consumers to take out loans or mortgages. On the other hand, higher interest rates can also lead to higher returns on savings and investments. This may incentivize some consumers to save more and reduce their spending in the short term. However, if higher interest rates are effective in controlling inflation, it can help maintain consumer purchasing power in the long run.
Unemployment Rate
Unemployment rate refers to the percentage of the labor force that is actively seeking employment but unable to find jobs. High unemployment rates can have a deflationary effect on the economy. When unemployment is high, people have less disposable income to spend, leading to reduced consumer demand. This decreased demand can result in lower prices as businesses may need to lower prices to stimulate sales and stay competitive. Lower prices, in turn, contribute to deflationary pressures in the economy.
Impact of Increasing Federal Funds
When the Federal Reserve increases the federal funds rate, it becomes more expensive for banks to borrow money. As a result, banks may increase the interest rates they charge consumers and businesses for loans, including mortgages, car loans, and business loans. Higher borrowing costs can discourage businesses from expanding and consumers from making large purchases, which can lead to reduced economic activity and potentially higher unemployment rates.
It’s important to note that the relationship between the federal funds rate, unemployment, and consumer spending is complex, and other factors can also influence these variables. Economic conditions, government policies, and consumer confidence are among the factors that can impact the outcome.
Provided by
Aaron Taylor
Senior Vice President
Valuation Advisory Services
503.721.2707
aaron.taylor@kidder.com
Stay in the know and subscribe to our monthly West Coast Market Trends report and our quarterly market research.
